
WaitTime Technology: Counting Crowds
Posted on Sep 9, 2022 by Xtreme Staff
WaitTime technology figures out how and where people move inside a stadium, which not only bolsters fan safety – but stimulates the possibilities for revenue
//Words by Neal Romanek//
Just as Professor Still had a moment of clarity about crowd management when stuck in a turnstile queue, Zachary Klima experienced an epiphany in the beer line at a Detroit Red Wings game – and missed the winning goal.
“I had the thought: ‘Wouldn’t it be great to know what all the wait times are in the concession queues or retail lines? Who in their right mind wouldn’t want to know that information?”
The company he created as a result, WaitTime, developed four algorithms for the measurement and behaviour of crowds: queueing, stanchion, massing and entry/exit. Unlike more complicated systems which use LiDAR or smartphone information to track movement, WaitTime’s technology analyses video imagery, employing ordinary camera feeds to record how a crowd moves in real time.
Four algorithms
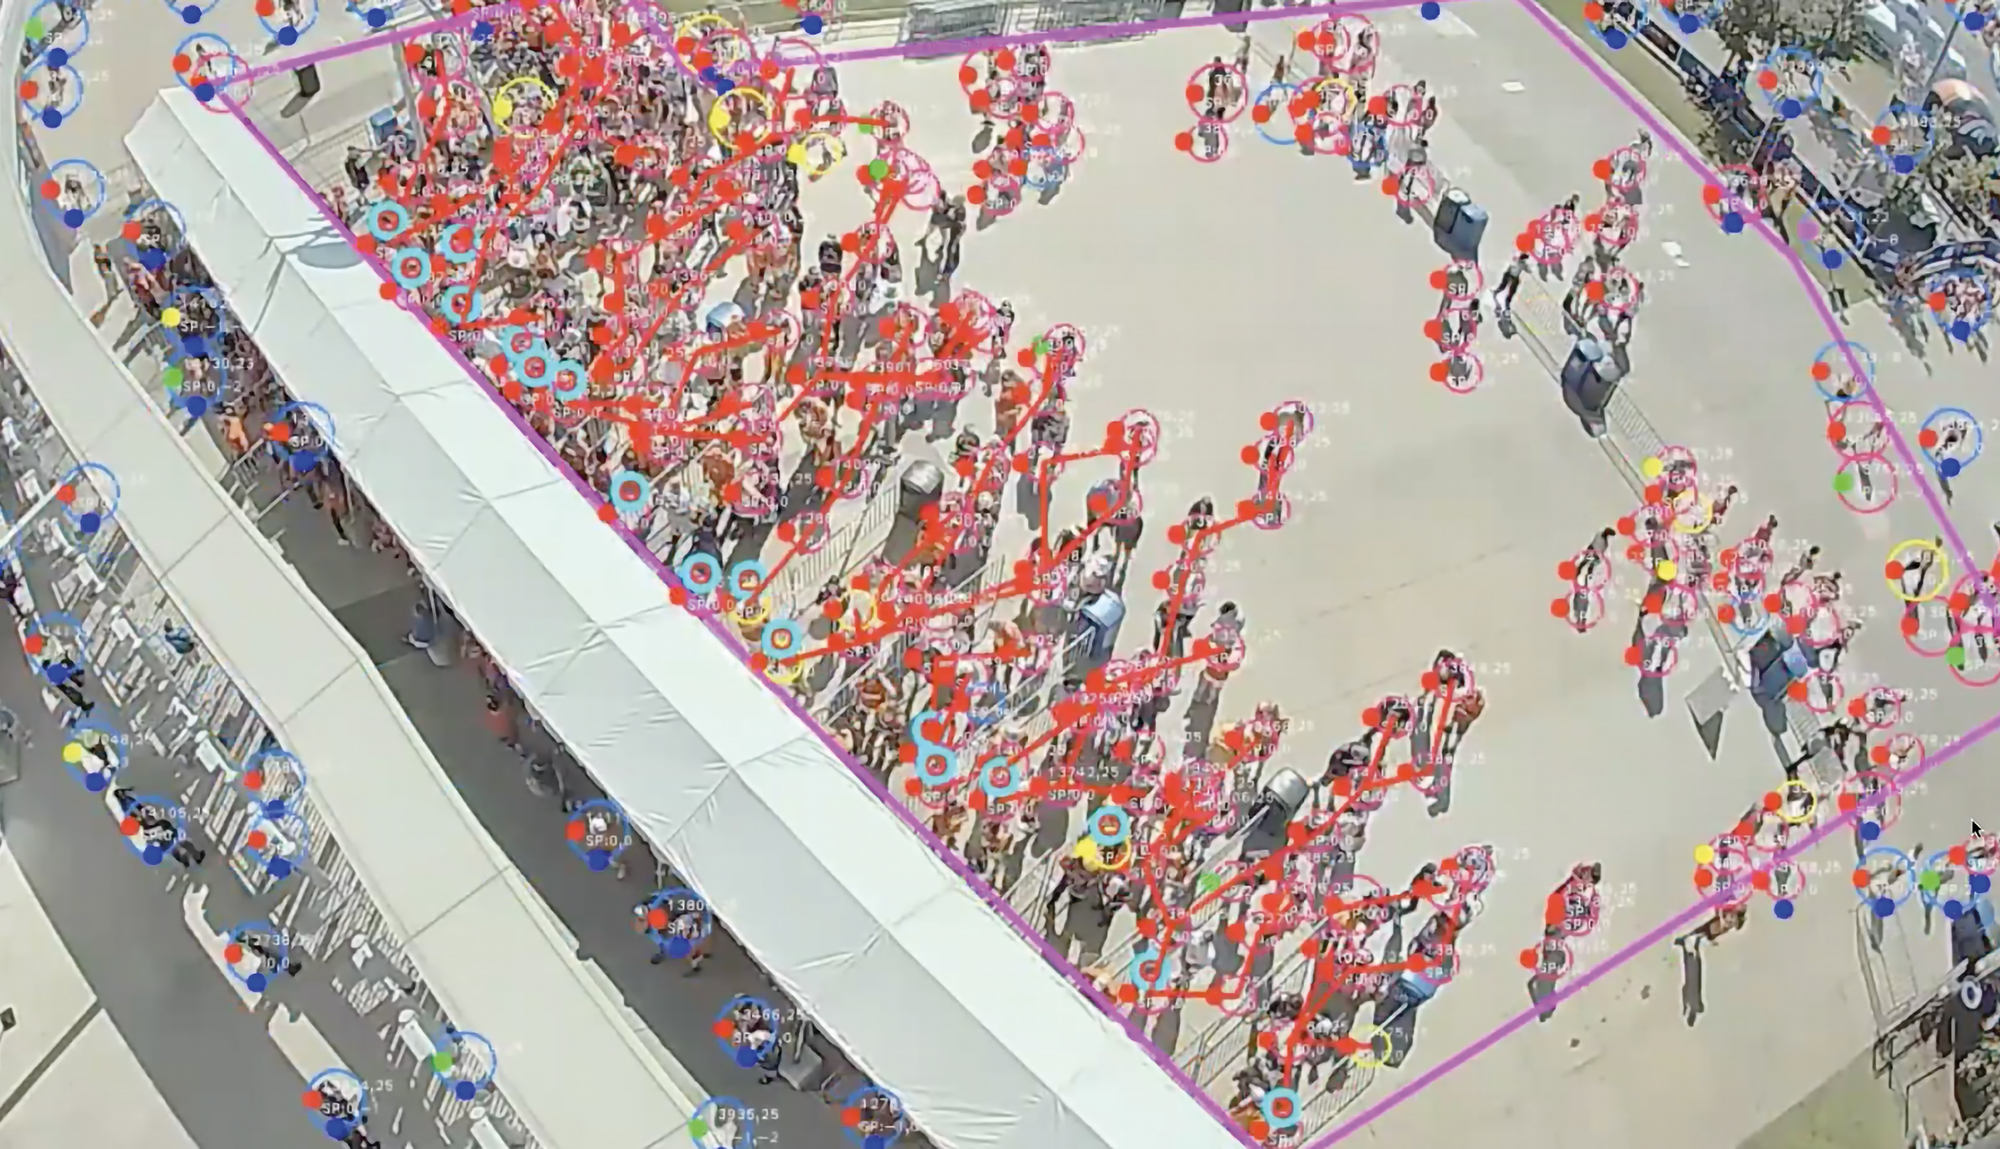
WaitTime’s queueing algorithm uses cameras with a bird’s eye view of locations where queues naturally form – concessions, bathrooms, ingress or egress points – to generate 24fps graphic overlays showing the number of people in line and rate of service. Deployed in major venues like the entrance to the Melbourne Cricket Ground in Australia, it provides real-time intelligence on exactly how long it takes a fan to get from the back of the queue to the front.
WaitTime technology figures out how and where people move inside a stadium, which not only bolsters fan safety – but stimulates the possibilities for revenue
//Words by Neal Romanek//
Just as Professor Still had a moment of clarity about crowd management when stuck in a turnstile queue, Zachary Klima experienced an epiphany in the beer line at a Detroit Red Wings game – and missed the winning goal.
“I had the thought: ‘Wouldn’t it be great to know what all the wait times are in the concession queues or retail lines? Who in their right mind wouldn’t want to know that information?”
The company he created as a result, WaitTime, developed four algorithms for the measurement and behaviour of crowds: queueing, stanchion, massing and entry/exit. Unlike more complicated systems which use LiDAR or smartphone information to track movement, WaitTime’s technology analyses video imagery, employing ordinary camera feeds to record how a crowd moves in real time.
Four algorithms
WaitTime’s queueing algorithm uses cameras with a bird’s eye view of locations where queues naturally form – concessions, bathrooms, ingress or egress points – to generate 24fps graphic overlays showing the number of people in line and rate of service. Deployed in major venues like the entrance to the Melbourne Cricket Ground in Australia, it provides real-time intelligence on exactly how long it takes a fan to get from the back of the queue to the front.
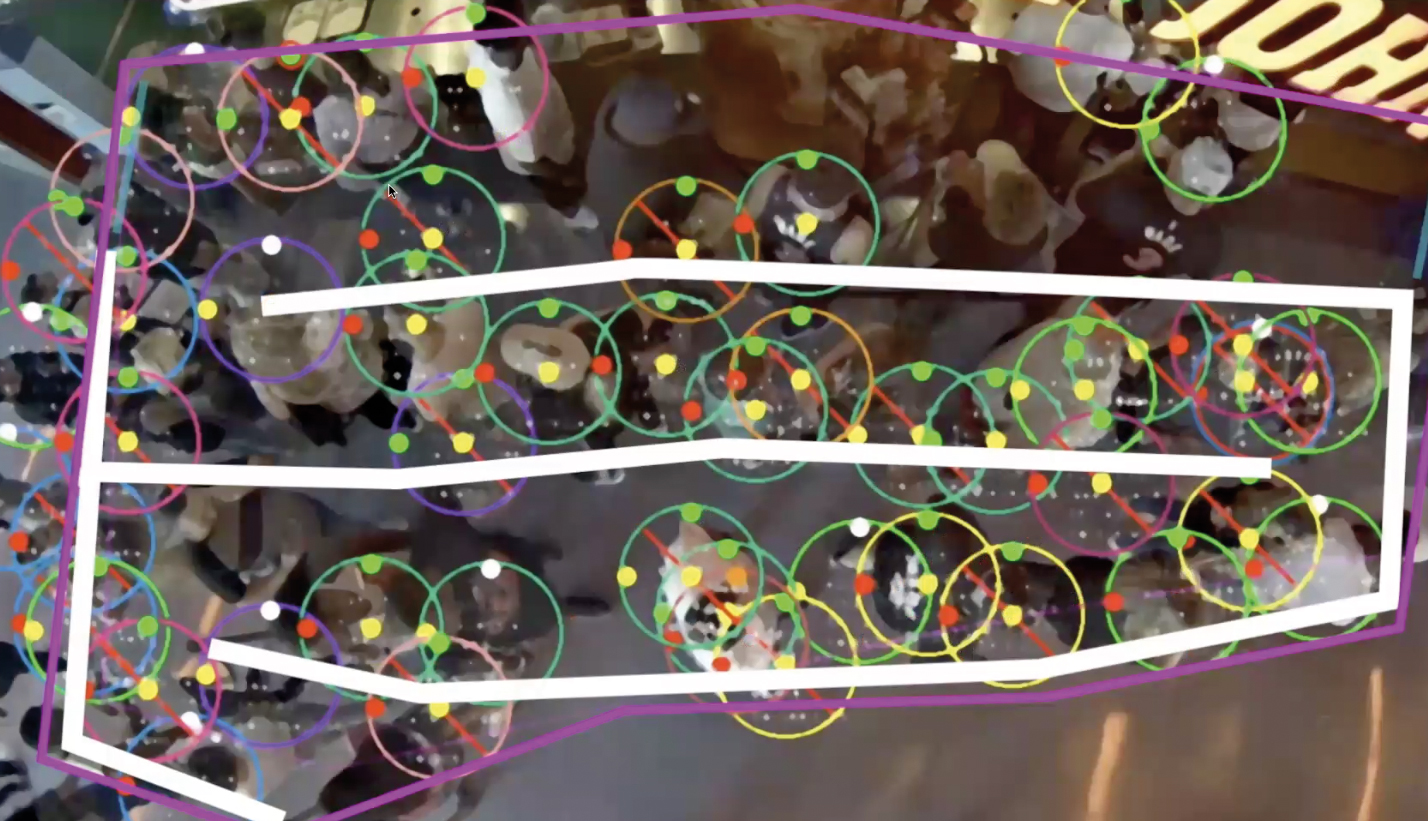
This is applied to unstructured crowds that form more organically, without external boundaries to keep them in place. On the other hand, WaitTime’s stanchion algorithm measures crowds that are confined by barriers or rope. These are epitomised by the lines at service points – concessions or retail – handling customer requests singly, rather than a ‘belly up to the bar’ group surge.
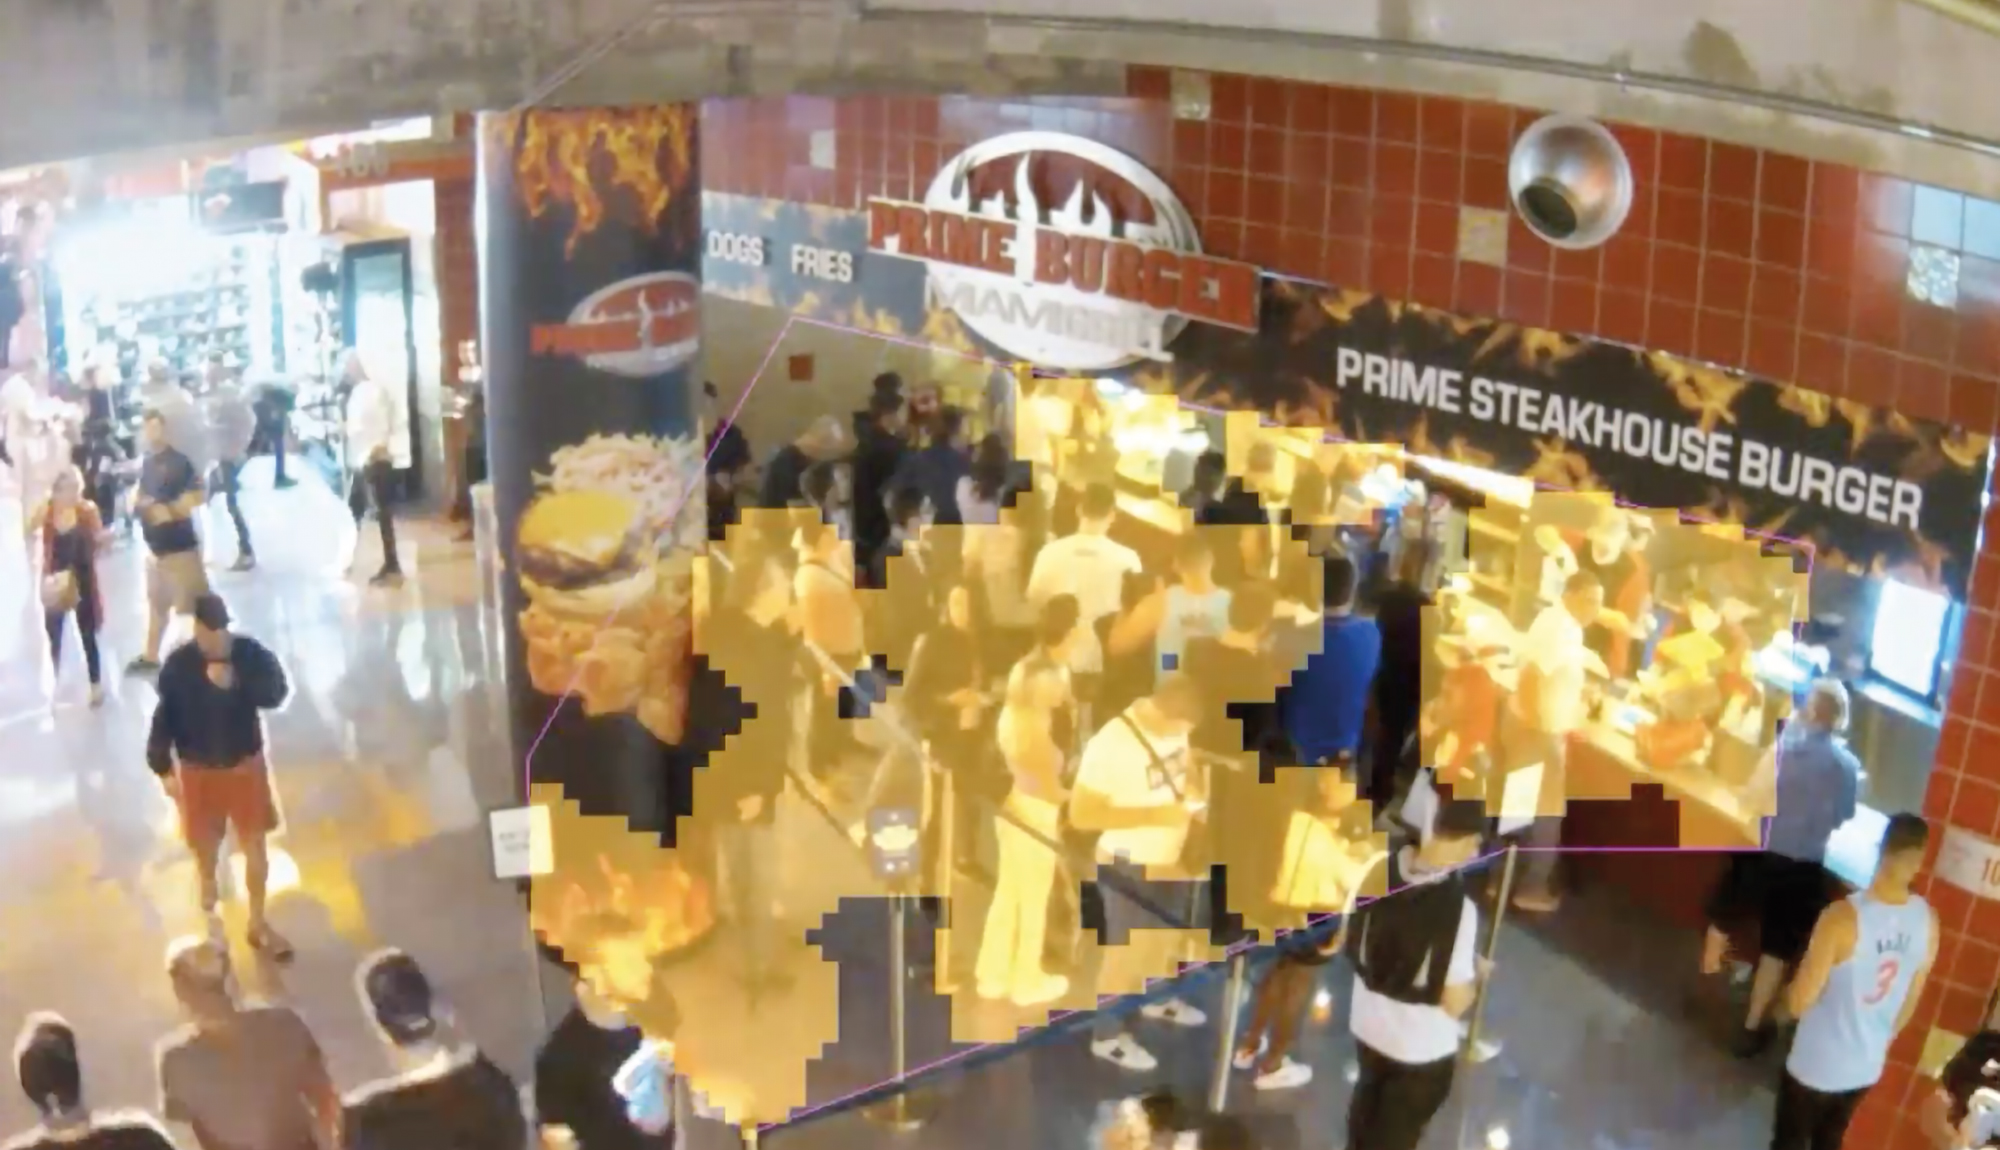
Sometimes, overhead cameras aren’t practical, or pre-existing cameras are already in a position to take in swathes of a site from an oblique angle. WaitTime’s massing algorithm measures the real-time crowd density of an area, delivering a graphic overlay like a heat map, highlighting human activity and giving a running percentage of how full any given area is.
WaitTime’s entry/exit algorithm delivers data and graphics on the rate and direction of human traffic in and out of a space. It operates at sites like the NEC in Birmingham, UK – and the Mall of America.
This is applied to unstructured crowds that form more organically, without external boundaries to keep them in place. On the other hand, WaitTime’s stanchion algorithm measures crowds that are confined by barriers or rope. These are epitomised by the lines at service points – concessions or retail – handling customer requests singly, rather than a ‘belly up to the bar’ group surge.
Sometimes, overhead cameras aren’t practical, or pre-existing cameras are already in a position to take in swathes of a site from an oblique angle. WaitTime’s massing algorithm measures the real-time crowd density of an area, delivering a graphic overlay like a heat map, highlighting human activity and giving a running percentage of how full any given area is.
WaitTime’s entry/exit algorithm delivers data and graphics on the rate and direction of human traffic in and out of a space. It operates at sites like the NEC in Birmingham, UK – and the Mall of America.
WaitTime developed four algorithms for the measurement and behaviour of crowds: queueing, stanchion, massing and entry/exit
Combining all the data from entry/exit cameras lets venue teams know how many people are inside at any point in time. This is useful for daily management of the area, but also a real asset in negotiating leasing agreements or working with advertisers and sponsors. The entry/exit software, first used in large shopping malls, is applicable when determining the number of people inside a place and the rate it empties or fills up. Entry/exit feedback was an important aspect of precautions taken during the height of the pandemic by initiatives like VenueShield: the public cleanliness programme launched by event management company ASM Global.
Processing the feedback
One of the great benefits of WaitTime’s algorithmic analysis is that no speciality capture gear is required for monitoring. Any camera feed – provided it is pointed in the right direction – can be evaluated for crowd data.
“The view is important,” explains Klima. “But a lot of venues are quite happy to move cameras if it means they get the right data. Or they just add more machines, because they are inexpensive.”
With the WaitTime operational dashboard, teams can monitor information from any location – and from a mobile device or web browser. Users set customised thresholds that trigger messages or notifications. If, for example, crowd density in an area hits a designated percentage, staff can be pinged. An end-of-event reporting tool offers a detailed overview of crowd behaviour throughout a venue in a chosen time frame. Teams can see the wait peaks and averages for every section, allowing them to glean insights about how the crowd interacts with the space.
“If the venue is offering a new menu item, what impact did that have on your crowd? If you change from stanchion to belly-up concession, how did that affect a location? How did going cashless alter the flow of people from event to event? There is so much you can do with it.”
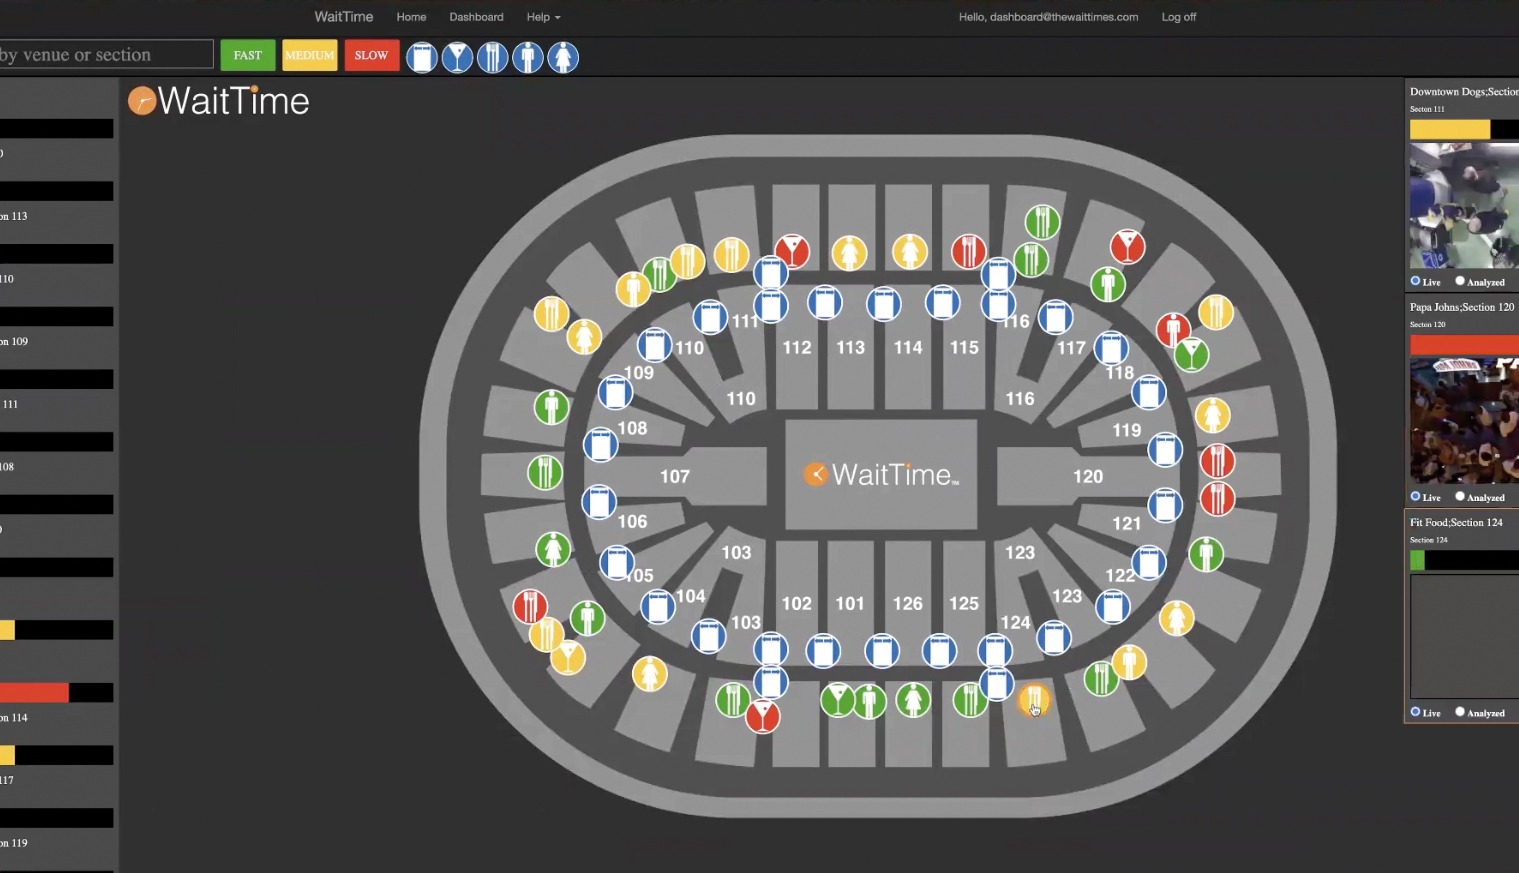
WaitTime is ported into in-venue screens, so fans get a live, up-to date signal of queue status.
“We have serviced more than five billion fans with our solution. Everyone wants to know this information, so you can have the attention of a lot of eyeballs and capitalise on that with advertising revenue. American Express, for example, can release an ad telling card users that they’ll receive 10% off at the concessions.”
The solution’s price point is based on a per-camera, per-month licensing fee, plus an additional amount for onboarding.
This article first featured in the Sept/Oct issue of FEED:Xtreme.